Cargando...
Recursos educativos
-
Nivel educativo
-
Competencias
-
Tipología
-
Idioma
-
Tipo de medio
-
Tipo de actividad
-
Destinatarios
-
Tipo de audiencia
-
Creador
-

Interpret. Reading graphs
EduBook Organización
- 1779 visitas
Study the bar chart which shows the CO2 emissions of some countries in the world. Then answer the questions. [...]
-

Video: Graphs of linear equations
Khanacademy Organización
- 1 lo usan
- 4044 visitas
This video (13- minutes long) helps us to understand graphs of linear equations.
-

Motion With Graphs with Examples
V&V Books Vicens Vives Organización
- 1149 visitas
DESCRIBING MOTION WITH GRAPHS Position vs. Time Graphs: Graphs are commonly used in physics. They give us much information about the concepts and we can infer many things.
-

Analyse. Learn to calculate and work with graphs
EduBook Organización
- 2097 visitas
Graphs help us to understand the relationships between the magnitudes represented on them. A very common way of drawing a graph is to give magnitudes to the quantities we are studying and transfer them…
-

Word population maps (interactive) - Graphs and maps - INED
Suzanne Teesdale Organización
- 2 lo usan
- 1099 visitas
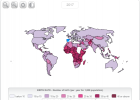
Interactive world population map for examining birth rates, etc.
-

Graphs of Uniformly Accelerated Rectilinear Motion (U.A.R.M.) | Fisicalab
V&V Books Vicens Vives Organización
- 1337 visitas
Graphs of Uniformly Accelerated Rectilinear Motion (U.A.R.M.): Theory, solved exercises, images, animations and equations of Physics.
-

Types of Graphs and when to use them
Esdres Jaruchik Organización
- 289 visitas
Video that shows different types of graphs and when it is best to use them.
-

Website: Hohli
Tiching explorer Organización
- 1 lo usan
- 2958 visitas
It is a free web-based service that allows us to create line graphs, Venn diagrams, 3D pie charts, bar graphs, radar graphs and some other types of info graphics.
-

Climate change predictions for Spain
V&V Books Vicens Vives Organización
- 1 lo usan
- 2156 visitas
Graphs of regionalized projections of climate change in Spain for the 21st century
-

Video: Graphing inequalities
Khanacademy Organización
- 1 lo usan
- 3689 visitas
This video (8- minutes long) helps us to understand inequalities graphs.
Te estamos redirigiendo a la ficha del libro...


